


ABM ROI comes down to one ratio and one comparison: pipeline created for every dollar spent, and how your ABM accounts performed against similar accounts you left alone. Most of the trouble teams have proving ABM ROI comes from trying to do something harder, which is assigning credit to each channel inside the program. That number never settles, and a budget built on it is easy to cut.
Here's the math we'd use, what goes into it, and the levers that move it.
TL;DR
- Aim for a 5:1 pipeline-to-spend ratio. At a close rate around 20%, that returns roughly a dollar in bookings for every dollar spent in year one.
- Measure ROI at program level, against a control group of similar accounts. Don't try to isolate channels.
- Count the full cost: platform, media, content, data, and the hours your team and sales put in.
- Use meetings as the early read. Pipeline arrives months after the campaign that created it.
- The fastest way to improve the ratio is to stop paying to reach people who were never part of the deal.
Why ABM ROI is hard to pin down
Three things get in the way.
Pipeline lags. By the time an opportunity shows up, the campaign that influenced it may have ended a quarter ago. If you judge the program on this month's pipeline, you're grading work you did in the spring.
ABM is many things at once. Ads, outbound, events, direct mail, and content all touch the same accounts in the same weeks. With that many moving parts, isolating the contribution of one channel is guesswork, and two reasonable people will split the credit differently.
Account-level reporting hides who was reached. "We influenced this account" can't be checked. When finance asks what the spend produced, a claim nobody can verify counts for very little.
So the useful version of ABM ROI is simpler than the one most teams attempt. Measure the whole program. Compare it with a control. Keep the evidence at the level of named people and deals, so the number can be opened up when someone asks.
The 5:1 pipeline-to-spend math
The rule of thumb from our ABM playbook is a 5:1 pipeline-to-spend ratio. For every dollar the program costs, it should create five dollars of qualified pipeline. With a close rate of about 20%, five dollars of pipeline becomes roughly one dollar of bookings.
Here's that waterfall with round numbers, as an illustration:
- Program spend for the year: $200,000
- Pipeline target at 5:1: $1,000,000
- Bookings at a 20% close rate: $200,000
Break-even on first-year bookings can sound modest. It's a floor. Customers renew and expand, so the lifetime return on those deals is higher than the first-year figure, and a program with a better close rate or larger deals clears the bar sooner.
Your numbers will differ, so run the waterfall with your own. If you close 30% of qualified pipeline, a 5:1 ratio returns $1.50 in bookings per dollar. If you close 10%, you need 10:1 to break even, and the program needs a different design before it needs a bigger budget.
What counts as spend
The ratio only means something if the denominator is complete. ABM budgets usually undercount, because the costs sit in different places.
- Platform and data. ABM software, enrichment, intent data, and any contact data you buy.
- Media. Ad spend on every channel the program uses, including the share of always-on campaigns aimed at target accounts.
- Content and creative. Assets made for the program, including the one-to-one pieces for top accounts.
- Events and direct mail. Dinners, gifting, and field events for target accounts.
- Labor. Marketing and operations time, plus the selling hours reps spend researching accounts after a vague alert. That last one rarely appears in a budget and it's often large.
If you're building the budget case from scratch, how to build and pitch a marketing budget covers the structure.
Measure the cohort against a control
The comparison that matters is your ABM cohort against a control group of similar accounts that didn't get the program. Same ICP, same segment, same period. The difference between the two groups is the program's effect, and it doesn't depend on anyone's attribution model.
The program behind our playbook measured it this way and reported 60% more meetings in the ABM cohort than in the control, and a 20% lift in pipeline. Those are program-level numbers from one team, and that's the point of them. They describe what the whole motion did.
Setting up a control is mostly discipline:
- Before launch, hold back a group of accounts that match the target list on fit.
- Leave them in your normal demand programs and out of the ABM plays.
- Compare meetings first, then pipeline, then win rate as the deals mature.
Holding accounts back feels like a cost. It's also the only way to show what the program added, so set the control group before launch and leave it alone.
Use meetings as the early read
You can't steer a program on a number that arrives six months late. Meetings with named contacts at target accounts show up within weeks, and sales accepts them as real. Track meetings per target account weekly, by cohort, and you'll know whether the ratio is on course long before pipeline confirms it.
If meetings are flat, check who's in the audience before you change the creative. The most common cause is that the ads are reaching the account and missing the committee.
How to hit 5:1
There are two ways to improve a ratio. Create more pipeline, or spend less creating it. In ABM the second is usually faster, because so much of the spend lands on people who were never going to be part of the deal.
- Aim ads at named contacts. Account-level targeting buys impressions across a company's whole employee list. Building audiences from identified, ICP-fit contacts removes most of that waste. Across Vector customers the averages are 40% lower cost per click, 33% lower cost per conversion, and 87% higher click-through rate.
- Act while the signal is fresh. The same ad works better in the days after a buyer visits pricing than it does a month later. Shortening the time between signal and touch raises conversion without raising spend.
- Keep audiences current. A list uploaded quarterly spends weeks of budget on people who've changed roles or left the market.
- Start small and prove it. Pick two or three reps, solve one problem for them by hand, and show the result. Goldcast reported 17x ROI within three months of moving from account-level to contact-level targeting, which is the kind of early proof that funds the next stage.
Report it honestly
A single large deal can make any ratio look spectacular. Report the number with the outlier and without it, say which period the pipeline came from, and call early results directional. A CFO will trust a 5:1 you've qualified over a 50:1 you haven't, and the trust is what protects the budget next year.
How Vector helps you prove ABM ROI
Vector keeps ad engagement, site visits, meetings, and the deal on one timeline per account, so the evidence behind an ROI number is already assembled when you need it. Pipeline influence reporting compares deals your ads touched with deals they didn't, which is the cohort comparison above without the spreadsheet work. It's in beta and covers LinkedIn ad data today.
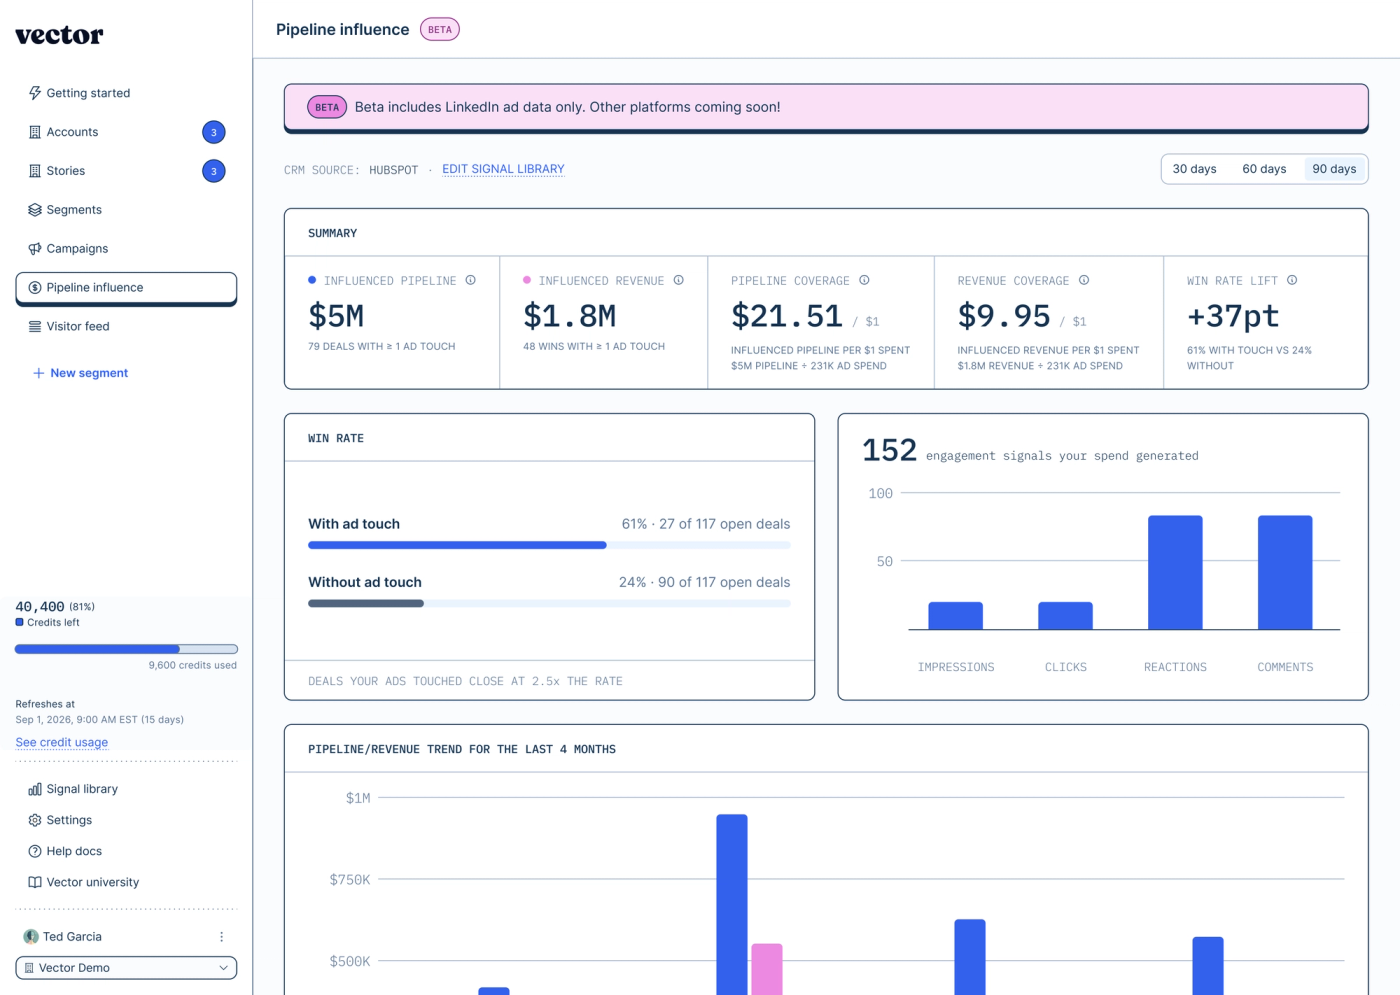
For each closed deal, the account's story shows the marketing touches on the way there, by contact and by date. Audiences are built from named contacts and pricing is flat, with no cut of your media budget, so more of what you spend reaches the buying committee.
If you know the program is working and can't yet show it, see how Vector handles ABM.
Frequently asked questions
What is a good ROI for ABM?
A common target is a 5:1 pipeline-to-spend ratio. With a close rate around 20%, that returns roughly one dollar in bookings for every dollar spent in the first year, before renewals and expansion.
How do you calculate ABM ROI?
Add up the full program cost, including platform, media, content, data, and labor. Divide the qualified pipeline created from target accounts by that cost to get the ratio, then apply your close rate to estimate bookings. Compare the result with a control group of similar accounts.
Why is ABM ROI hard to measure?
Pipeline appears months after the campaign that influenced it, and several channels touch the same accounts at once. That makes channel-level credit unreliable. Program-level measurement against a control group avoids the problem.
What is a control group in ABM?
A set of accounts that match your target list on fit and are held out of the ABM plays. They stay in your normal demand programs. The difference in meetings, pipeline, and win rate between the two groups is the effect of the program.
How long does it take to see ROI from ABM?
Meetings with named contacts at target accounts should move within weeks. Pipeline follows over one or two quarters, and program-level ROI is usually judged over six to twelve months.