


An ABM metric earns a place in your report when it names a person or a deal. Most ABM dashboards are built from the other kind: counts of accounts, impressions, and alerts that look busy and can't tell finance what any of it became. If you've walked into a budget review with a slide full of "engaged accounts" and walked out with a smaller budget, you've met the problem already.
This is the list we'd keep, the list we'd drop, and the reason each one lands where it does.
TL;DR
- Keep the ABM metrics that resolve to named contacts, meetings, and deals. Drop the ones that stop at a logo.
- Twelve metrics cover the whole program: two for fit, three for engagement, three for activation, two for the sales handoff, and two for proof.
- Six common metrics (MQAs, surging-account counts, impressions against a list, logo-level influence, form-fill cost per lead, blended CTR) measure activity and should leave the executive report.
- Pick one north star the sales team already trusts. Meetings per target account is the one we'd choose.
- Never add numbers from different signal types together. Company-level reach and person-level engagement are different populations.
Why most ABM dashboards fail the CFO test
Account-based reporting grew up around the account. Platforms scored accounts, staged accounts, and counted how many accounts were "engaged," and the dashboards followed. The trouble starts when someone asks a follow-up question. Which people at those accounts? What did they do? Which deals did it touch?
An account-level number can't answer, because the detail was rolled up before it reached the report. That's the gap that shows up at renewal time: a program measured on marketing-qualified accounts gets cut when the CFO asks what those accounts turned into and nobody can say.
The fix is a different unit of measurement. When a metric is built from identified people and real opportunities, every number on the slide can be opened up and traced to a name, a date, and a deal. That's the standard the twelve metrics below are held to, and it's the same reason form-fill attribution undercounts marketing in the first place.
The 12 ABM metrics that matter
They're grouped by the job each one does. You don't need all twelve on one slide. You need the right two or three for the question being asked.
Fit: are you aiming at the right accounts?
1. ICP share of pipeline. Pipeline from accounts that match your ideal customer profile, divided by total pipeline. If the share is falling, the program is generating activity outside the accounts you chose. It's the cleanest check on whether your ICP is running in market or sitting in a deck.
2. Target account coverage. The share of target accounts where you've identified at least one real contact on the buying committee. An account with no named contacts can be advertised at, but it can't be worked.
Engagement: are the right people responding?
3. Named contacts engaged per target account. Count identified people who visited, clicked, replied, or attended. One engaged contact is a lead. Four at the same account is a deal forming.
4. Buying-committee coverage. Of the roles that have to say yes, how many have you reached? One analysis of 12 months of ABM campaigns found closed-won deals averaged 6.2 stakeholders, and deal velocity rose 34% when targeting expanded from two people per account to six or more. If you're tracking one champion, you're measuring a fraction of the buying group.
5. Stage progression and regression. How many accounts moved forward a buying stage this month, and how many slipped back. Report both. A program that only shows progression is hiding the accounts that went cold.
Activation: is the spend reaching them efficiently?
6. Cost per engaged contact. Total program spend divided by identified contacts who engaged. It replaces cost per lead, which only counts the people who filled out a form.
7. Cost per ICP click. Ad spend divided by clicks from people who fit your ICP. A cheap click from someone who'll never buy is waste with a good CPC. We've written up how to calculate cost per ICP click separately.
8. Signal-to-touch time. Hours between a buying signal and the first ad or outreach that follows it. In Kaylee Edmondson's dataset, accounts that got three or more touches within 48 hours of showing intent converted four times better than accounts that got the same content a week later, and conversion dropped 48% when sales follow-up slipped past 72 hours. Speed is measurable, so measure it.
Sales handoff: is it turning into conversations?
9. Meetings per target account. Booked meetings with named contacts, divided by accounts in the program. Pipeline takes months to show up. Meetings show up in weeks, and sales already treats them as real. That makes this the best single number to optimize against, and it's the one our ABM playbook is built around.
10. Pipeline leakage. Accounts where the buying signals showed up and no sales activity followed. It's found money, and you can only see it when marketing signals and sales activity sit in the same record.
Proof: what did it turn into?
11. Influenced pipeline, with named touches. Open and won opportunities where marketing reached members of the buying committee, with the contacts, programs, and dates attached. The number matters less than the fact that every deal behind it can be opened and read.
12. Win rate, touched versus untouched. Compare deals where the committee saw your ads or content against similar deals where it didn't. A cohort comparison holds up better than any attribution model, because it doesn't ask anyone to agree on how credit gets split.
The 6 ABM metrics to stop reporting
None of these are useless to the person running campaigns day to day. They don't belong in front of leadership, because each one describes activity and leaves out who or what it produced.
- Marketing-qualified accounts (MQAs). A threshold on a score. It says an account crossed a line and nothing about which buyer did it. Replace with named contacts engaged per account.
- Surging or "warm" account counts. Third-party topic surges are useful for planning. Reported as an outcome, they're a count of alerts. Replace with meetings per target account.
- Impressions delivered against your target account list. You paid to reach a company. You don't know if you reached the committee. Replace with cost per engaged contact.
- Logo-level "influenced accounts." "We influenced Acme" can't be checked. Replace with influenced pipeline that lists the contacts.
- Form-fill cost per lead. It measures the small share of buyers who raise their hand and ignores the rest of the committee. Replace with cost per engaged contact.
- Blended click-through rate. CTR across everyone who saw the ad tells you the creative got clicks. Replace with cost per ICP click.
How to build one scorecard from the twelve
Twelve metrics is a menu. A working scorecard has about six, and it changes depending on who's reading it.
- Choose one north star. We'd pick meetings per target account. It moves fast enough to steer by and sales won't argue with it.
- Add three leading indicators. Named contacts engaged per account, buying-committee coverage, and signal-to-touch time tell you whether meetings are about to rise or fall.
- Add one cost metric. Cost per engaged contact keeps the program honest about efficiency.
- Add one proof metric. Influenced pipeline with named touches, reviewed quarterly, is what finance will ask for.
One rule keeps the scorecard trustworthy: don't do arithmetic across signal types. The number of companies your LinkedIn ads reached and the number of identified people who engaged are different populations. Put them side by side. If you add them together, the total describes nothing, and the first person who asks how you got it will stop trusting the rest of the page.
How Vector reports on ABM
Vector is the ABM platform that shows its work. Every signal it collects, from a site visit to a closed deal, lands on one timeline per account, with people attached wherever a real person has been identified. Because ad engagement, site visits, meetings, and the deal itself sit in the same record, the proof metrics above don't have to be rebuilt from exports at the end of the quarter.
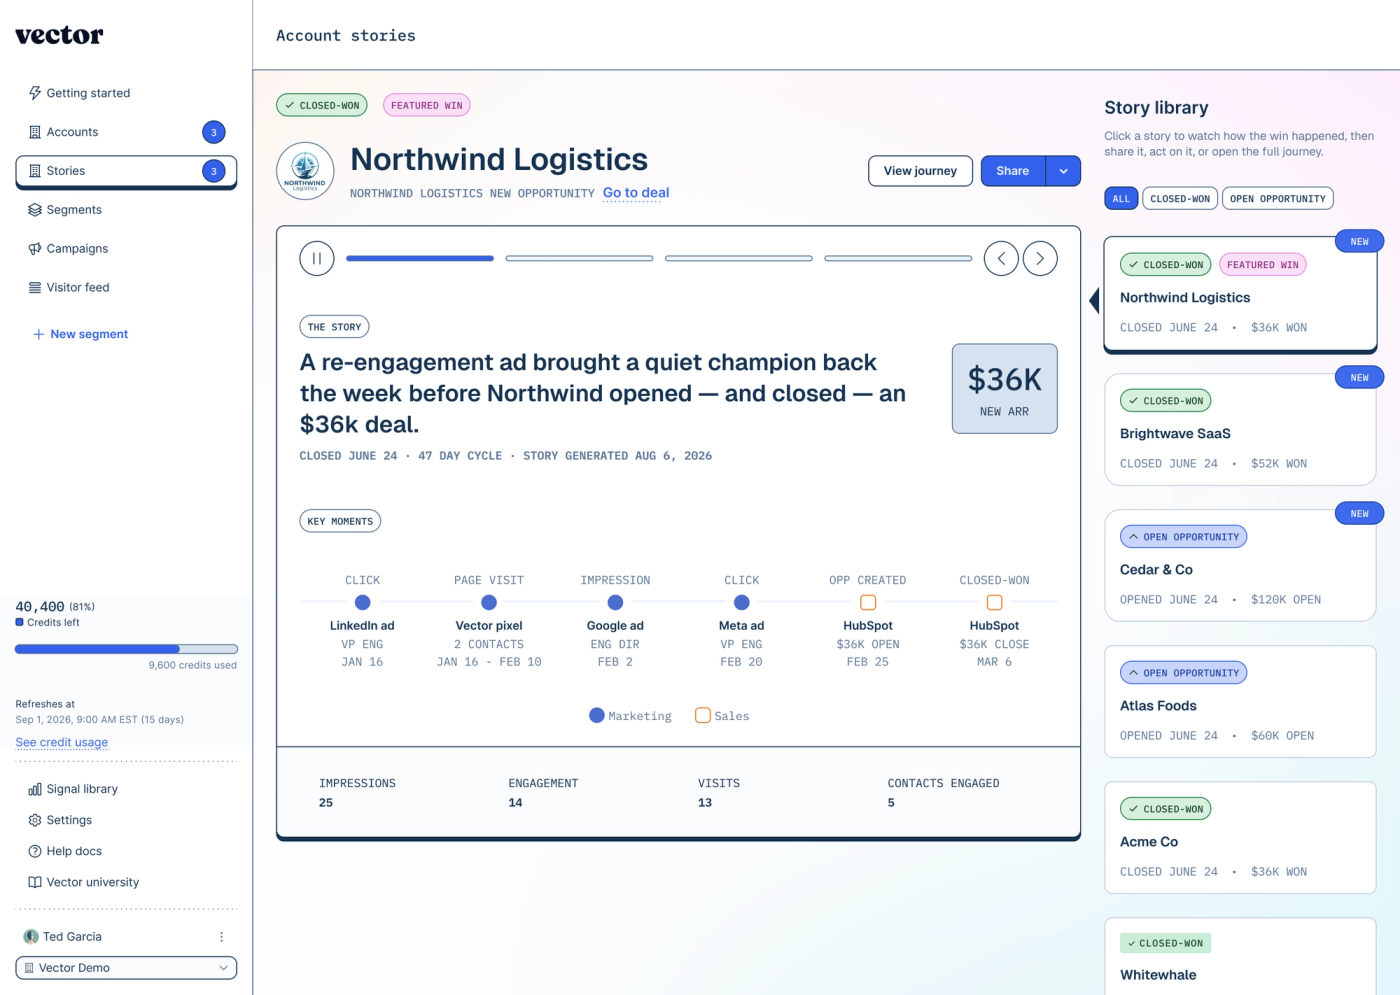
When a deal closes, the account's story shows every marketing touch on the way there, by contact and by date, without a data project to assemble it. That's the slide you bring to the budget meeting. For the quantitative side, pipeline influence reporting compares deals your ads touched with deals they didn't. It's in beta and covers LinkedIn ad data today.
If your current report can tell you how many accounts are warm and can't tell you who to call, see how Vector handles ABM.
Frequently asked questions
What are ABM metrics?
ABM metrics measure how an account-based marketing program is performing against a defined list of target accounts. The useful ones track named contacts engaged, meetings booked, and pipeline influenced, so each number can be traced to a person or a deal.
What is the most important ABM metric?
Meetings per target account is the one we'd pick as a north star. Meetings show up within weeks, which makes them fast enough to optimize against, and sales already treats them as real. Pipeline is the goal, but it arrives months after the campaign that created it.
Why are MQAs a weak ABM metric?
A marketing-qualified account is a threshold on a score. It tells you an account crossed a line and says nothing about which buyer did it or what happened next. When finance asks what those accounts became, the metric has no answer.
How many ABM metrics should be on a scorecard?
About six. Choose one north star, three leading indicators, one cost metric, and one proof metric. A longer list makes it harder to see what changed and invites people to pick the number that flatters the program.
How do you measure ABM influence on pipeline?
List the open and won opportunities where marketing reached members of the buying committee, with the contacts, programs, and dates attached. Then compare win rates for those deals against similar deals marketing didn't touch. The comparison holds up better than an attribution model because nobody has to agree on how credit is split.